Monitoring JAVA Application
JAVA VisualVM Tool
This tool is part of JDK 6, update 7 onwards
https://visualvm.java.net/gettingstarted.html?Java_VisualVM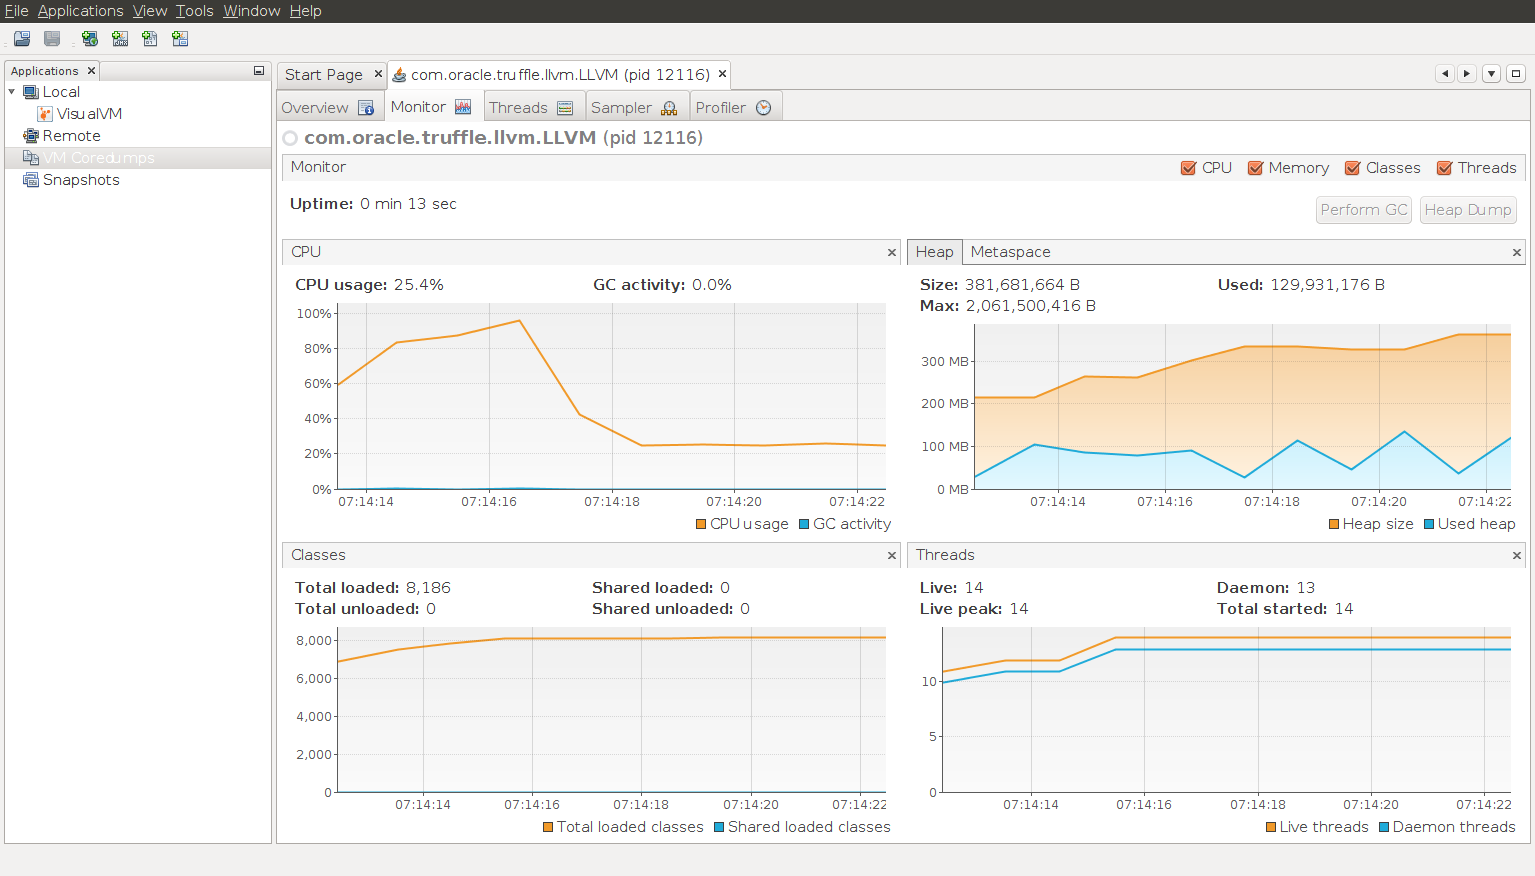 Screenshot from nbody benchmark with 1000000 iterations
- Started Java Visual VM using 'jvisualvm' command
- Downloaded benchmarks for sulong using 'mx su-pullbenchmarkgame'
- Executed benchmark using 'mx su-run nbody.ll 1000000'
- As soo as the execution started, JVM process appeared on the left pane of the window
- On clicking the processes 5 tabs showed different type of information. Profiler was not enabled so profiling information was unavailable.
Any other applications like server application could be monitored in this way
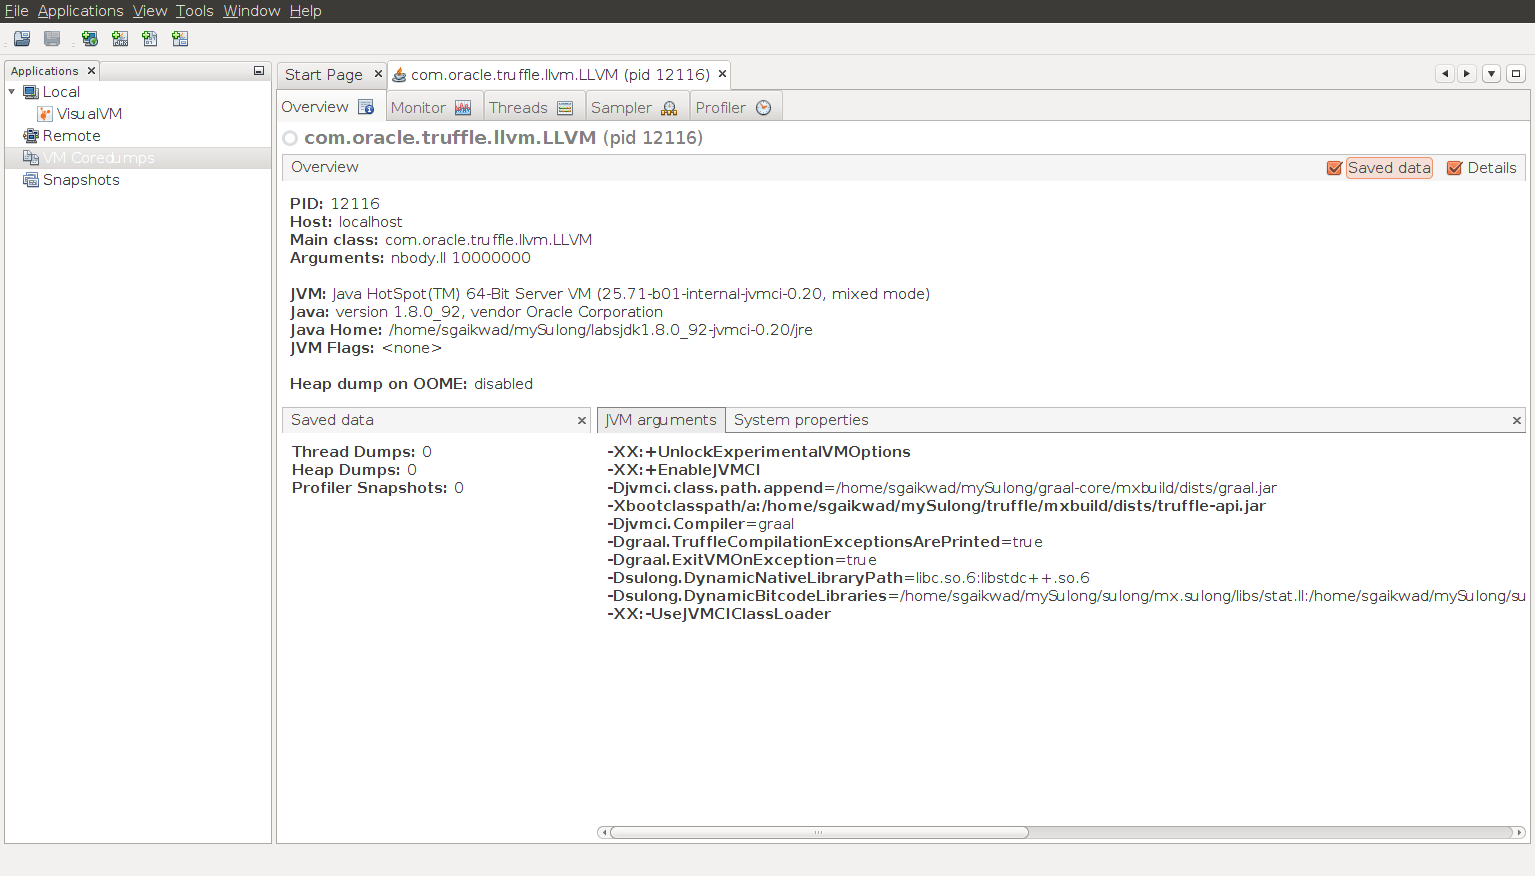
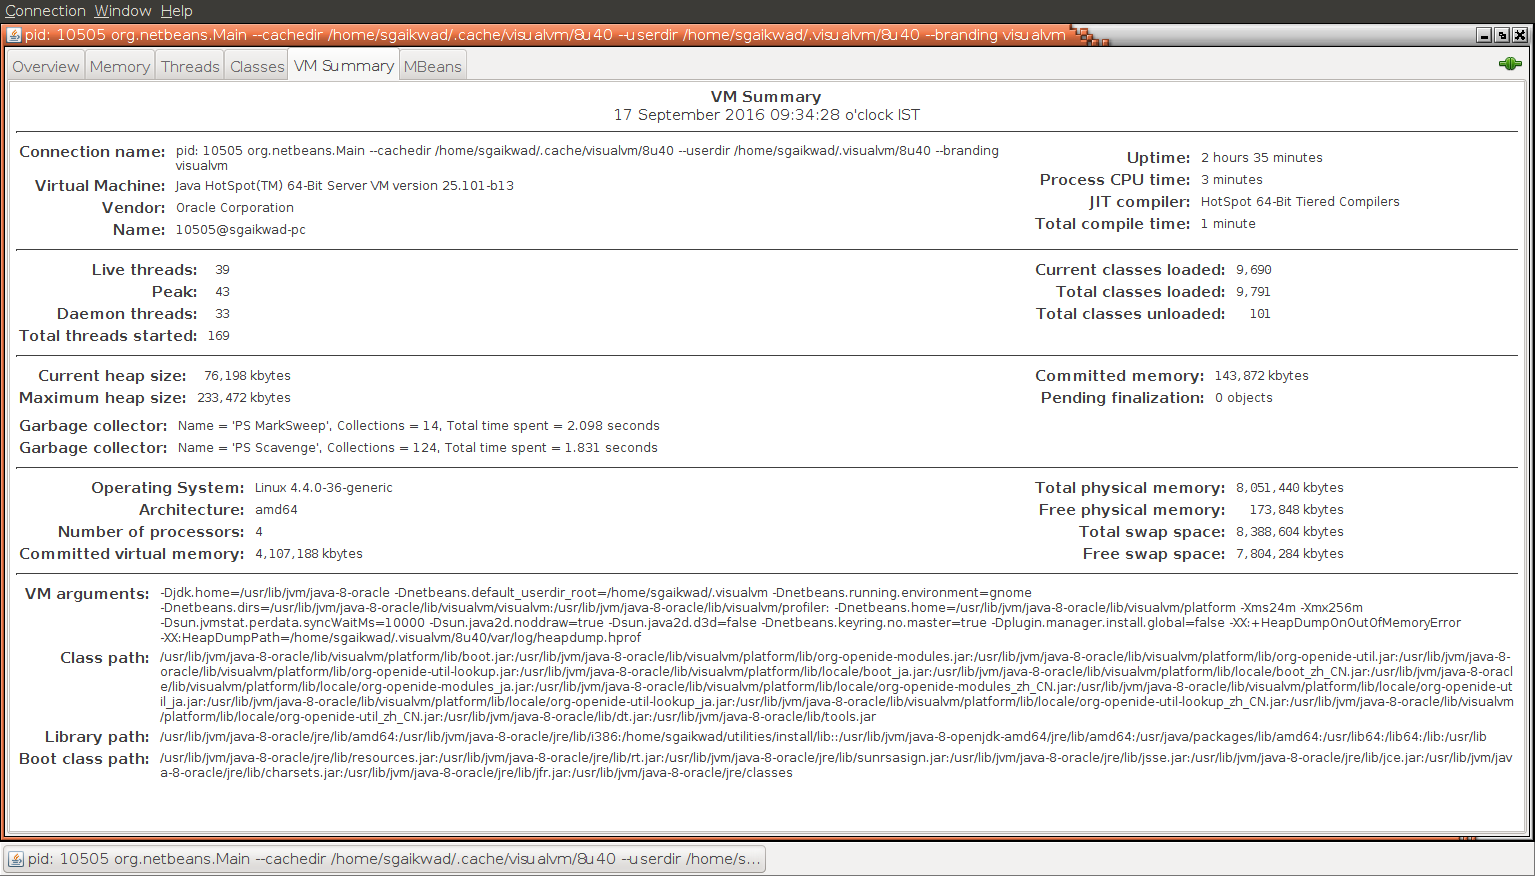
Overview tab shows the different options with JVM has started
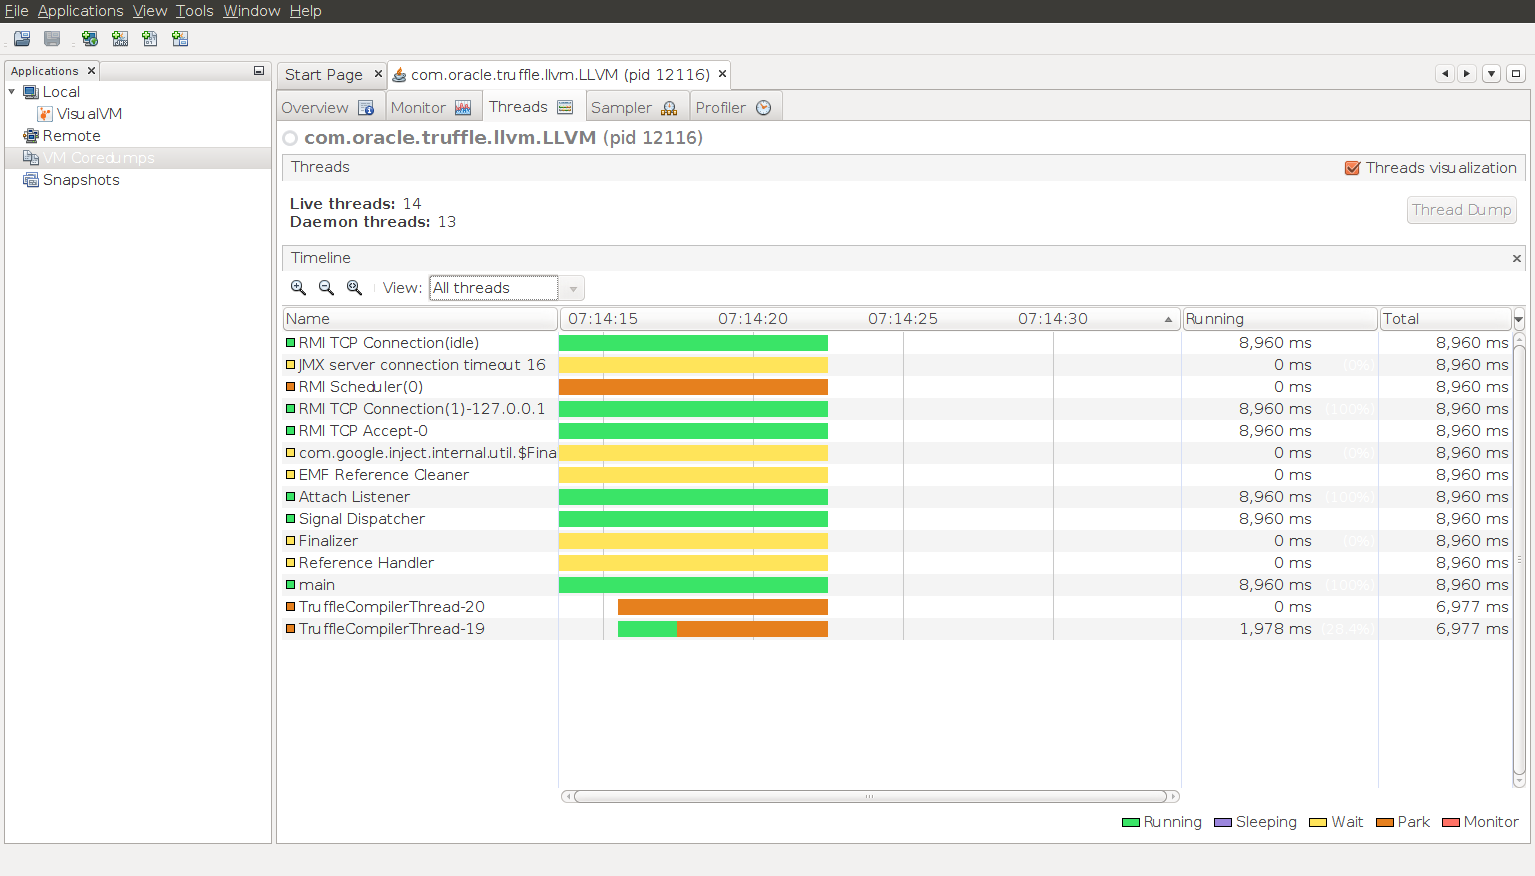
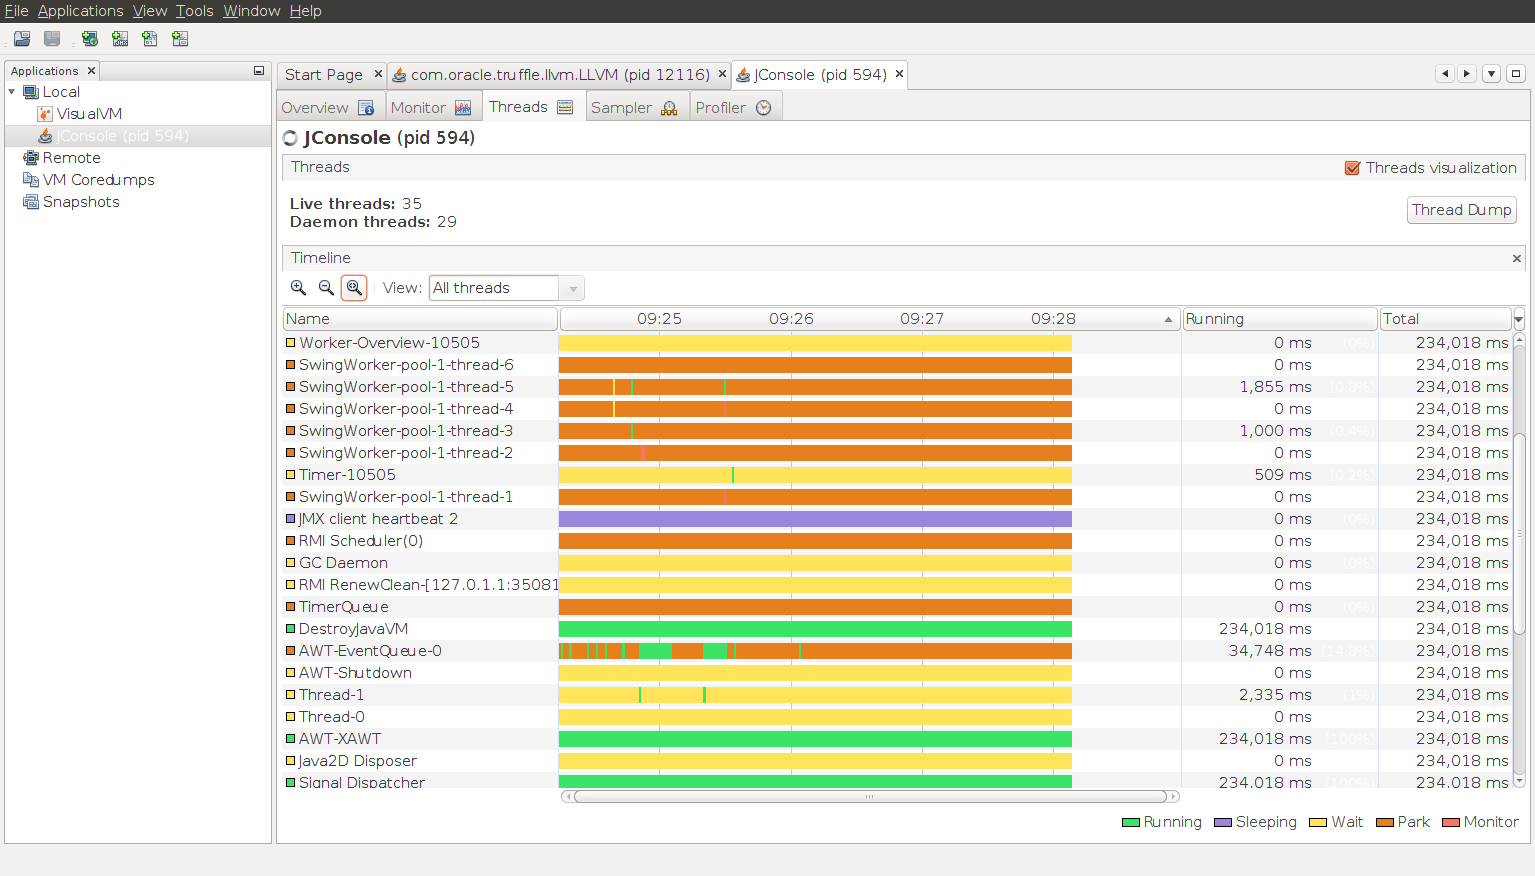
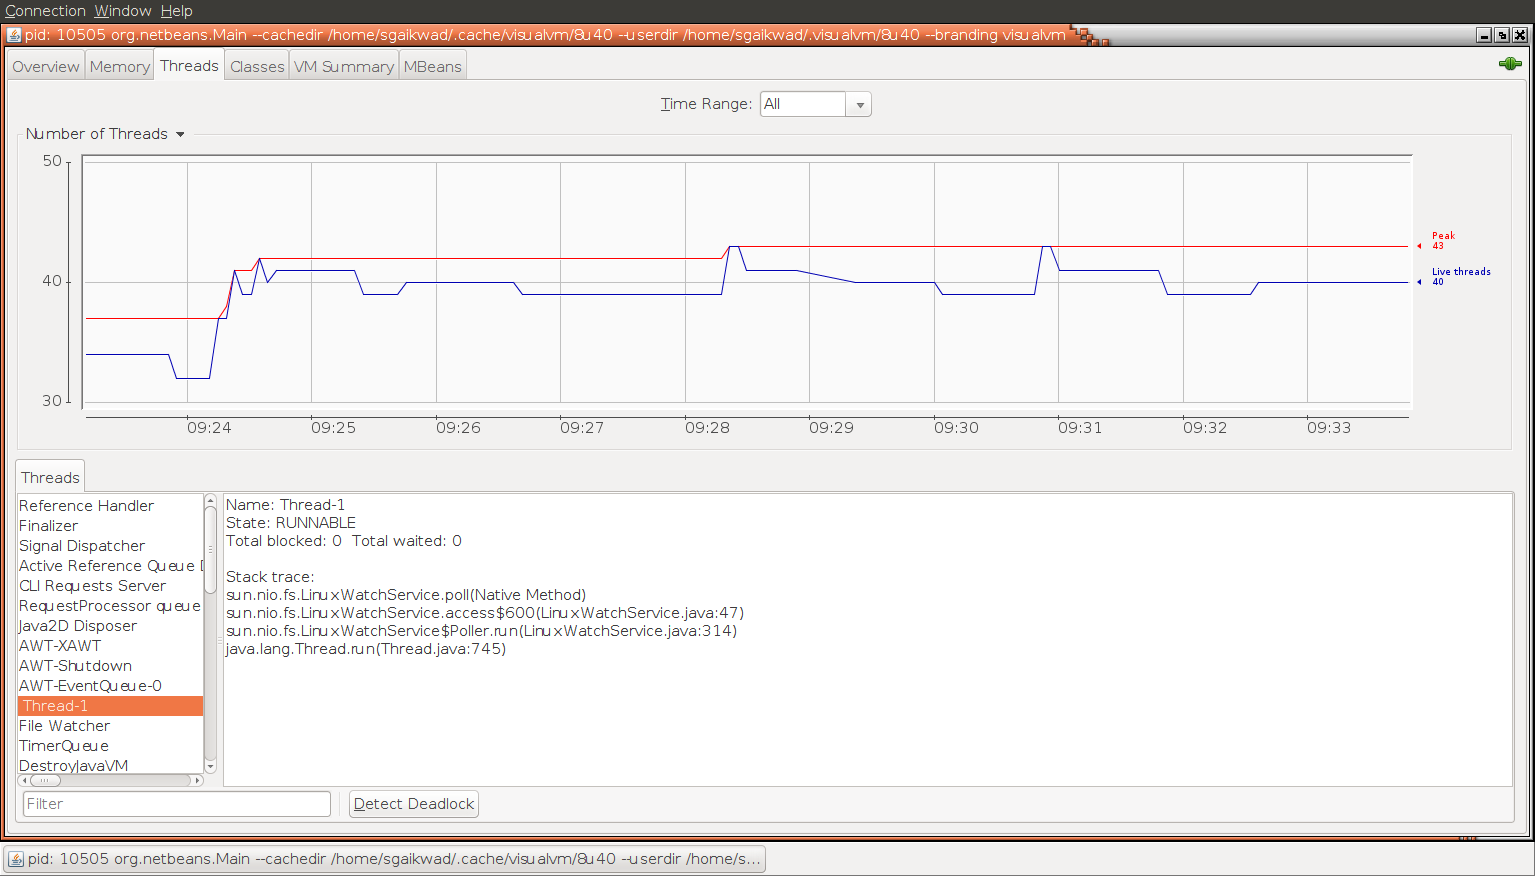
- Threads tab shows the list of total threads and their phases during execution
JConsole - Java Monitoring and Management Console
- Similar to Java Visual VM, JConsole also comes along with JDK
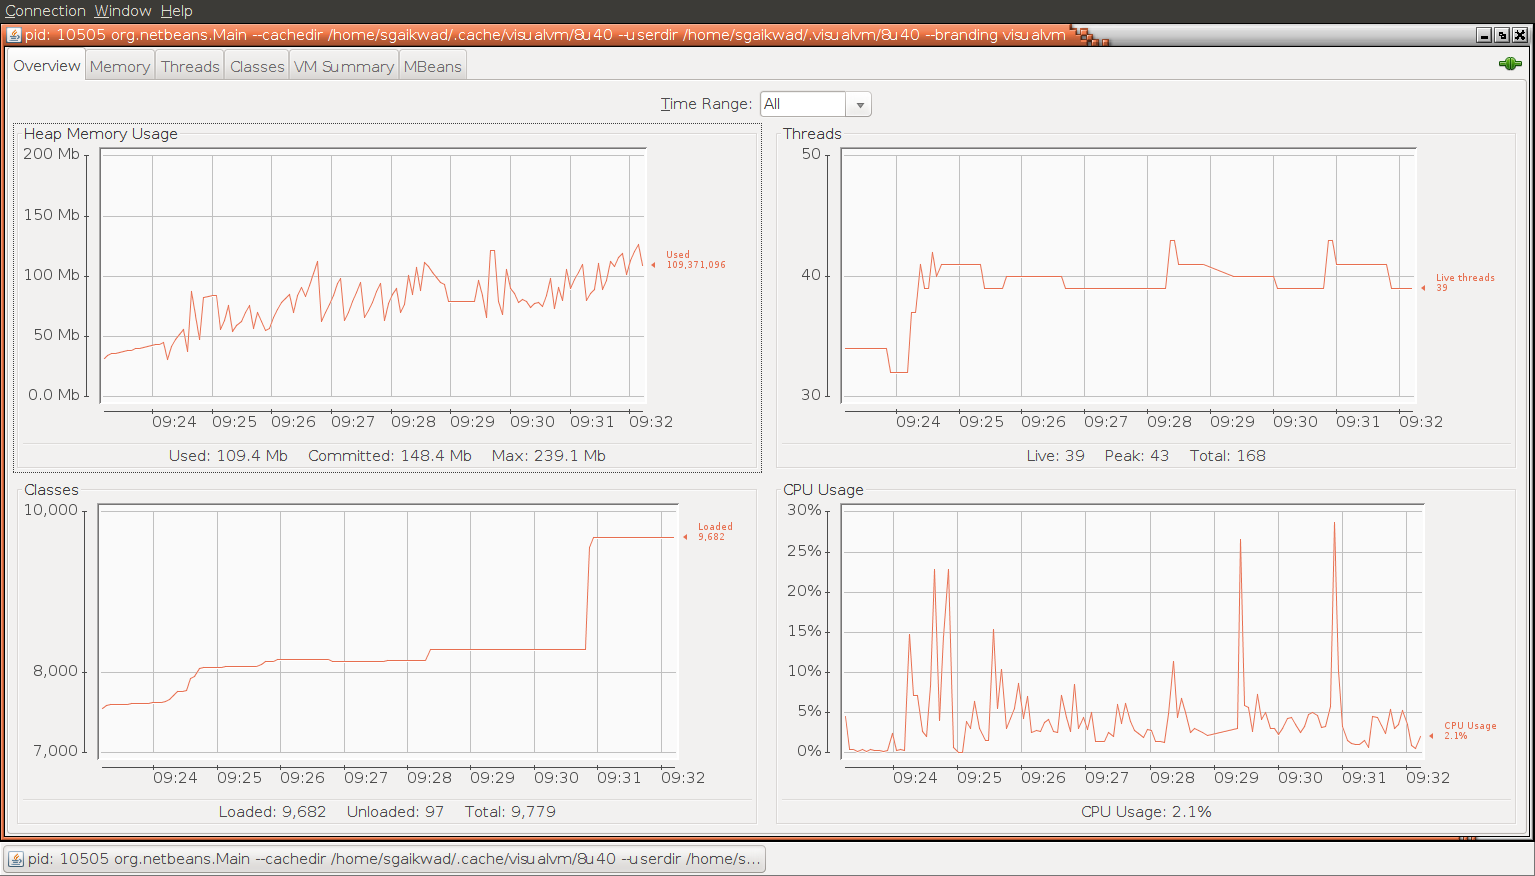
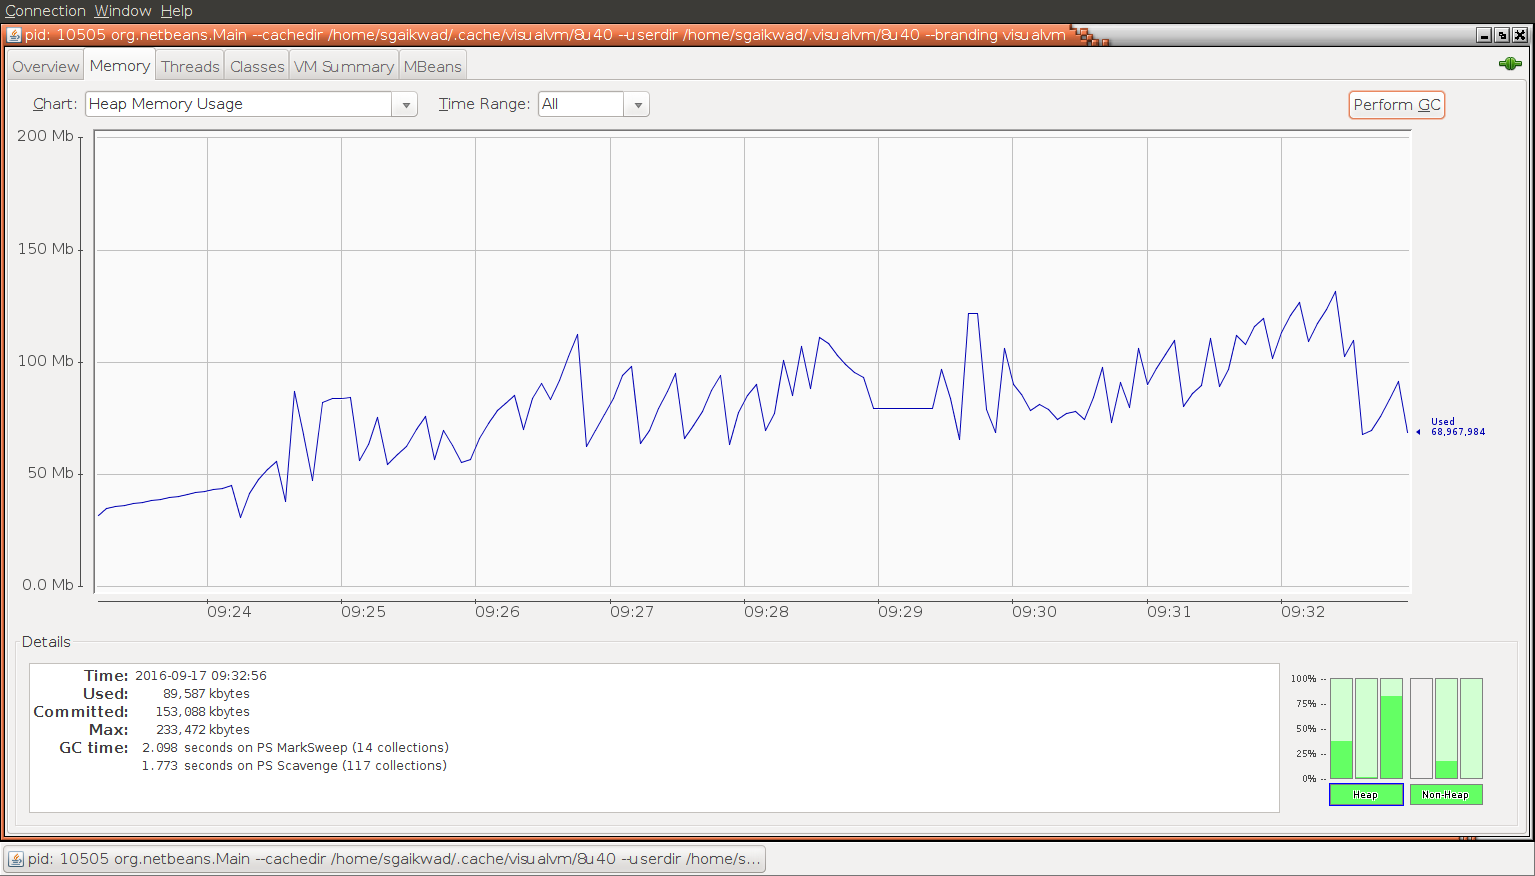
- It is used for monitoring JVM. It also provides functionalities to monitor heap, threads, memory, cpu consumption of the application.
- Helps indentifying memory leaks, thread looping, lock contention, deadlocks.
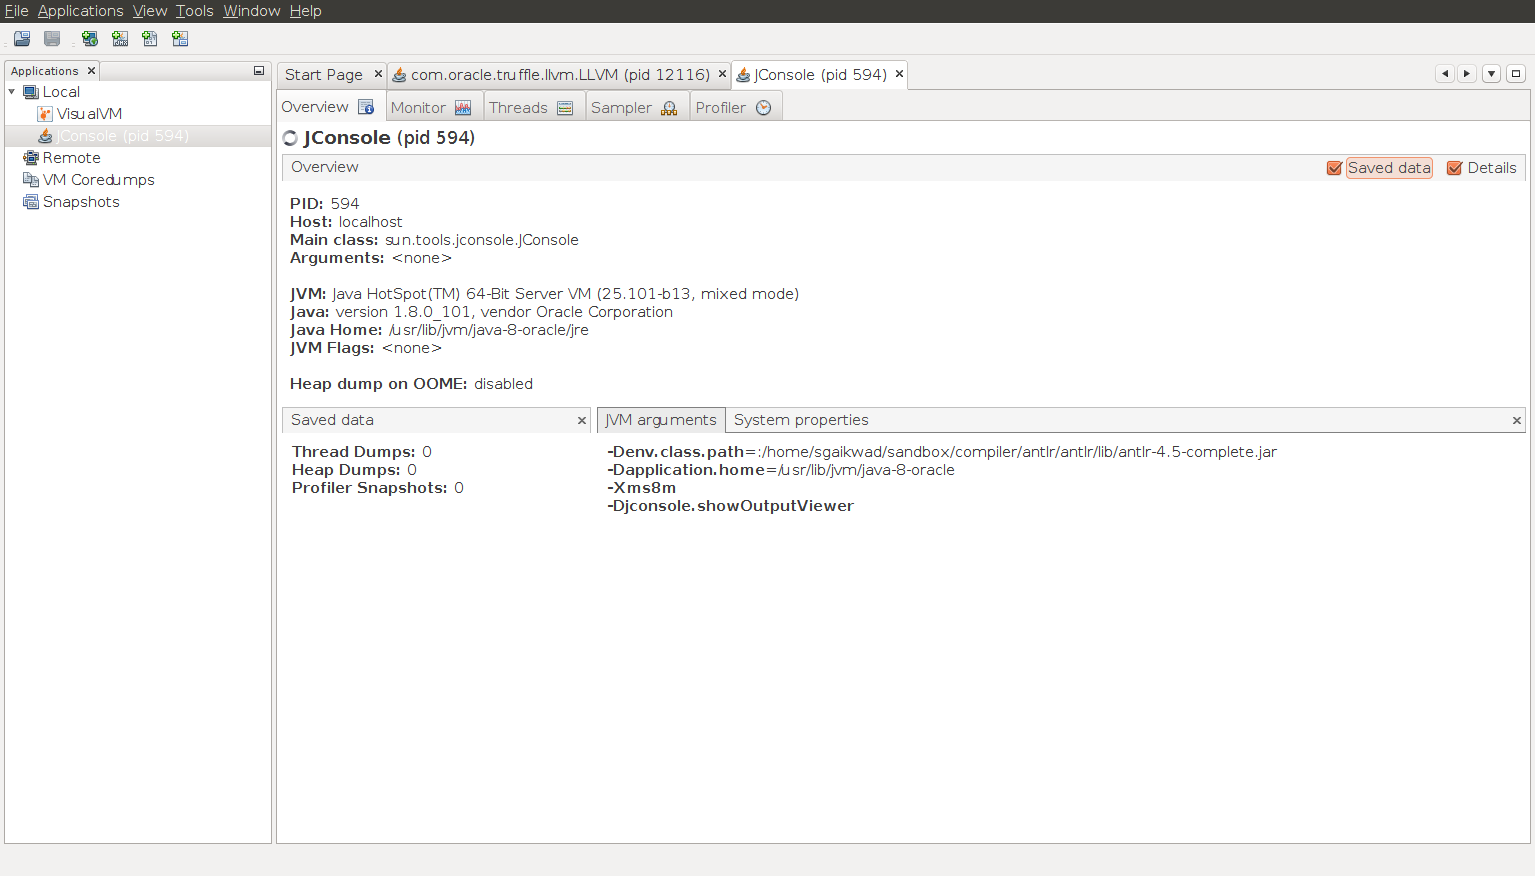
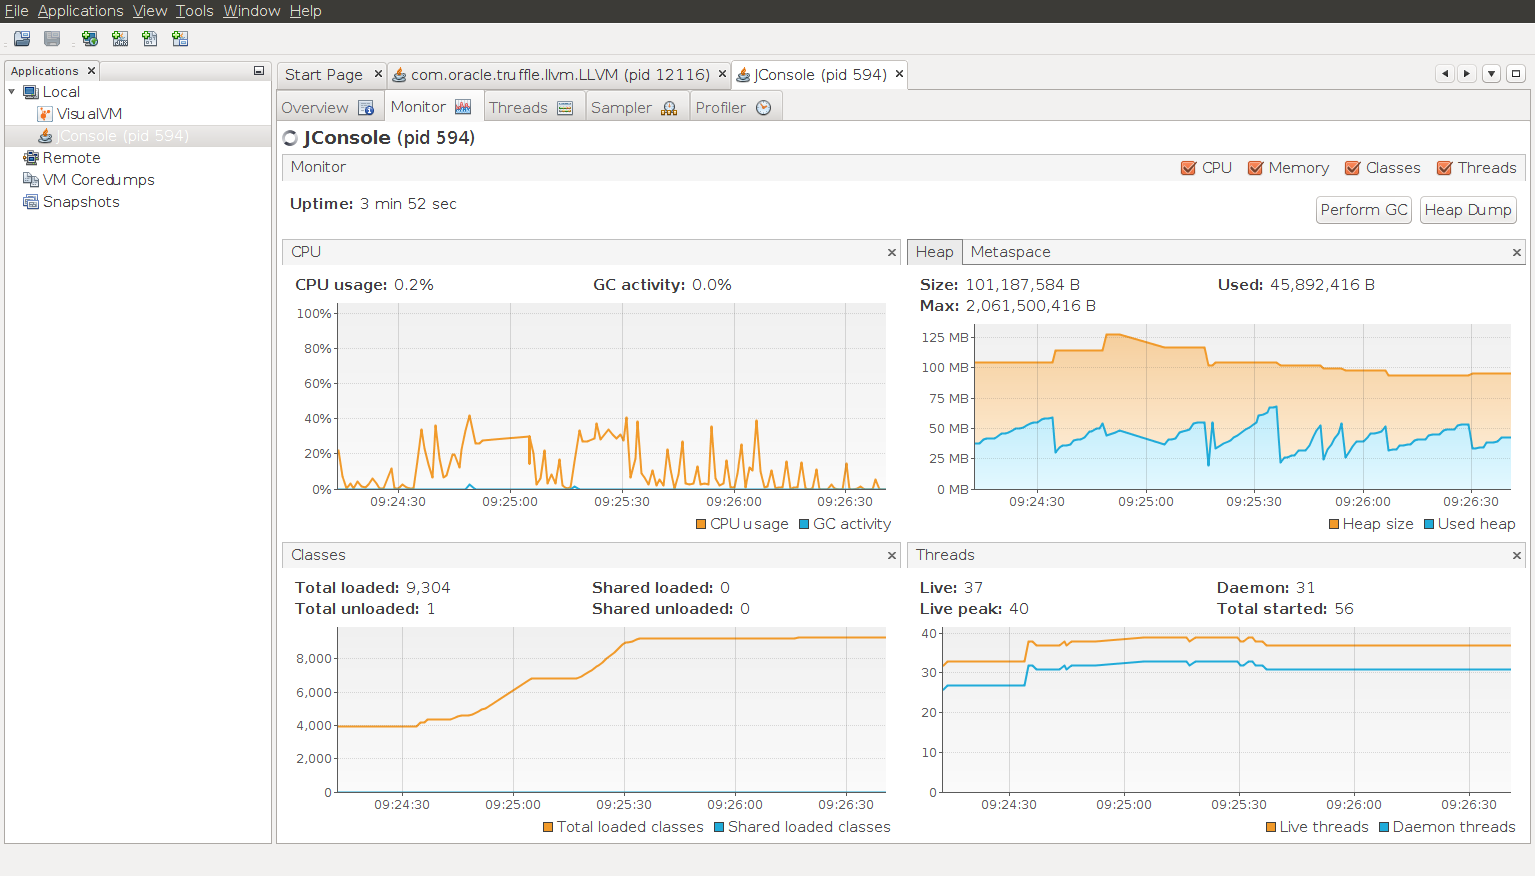
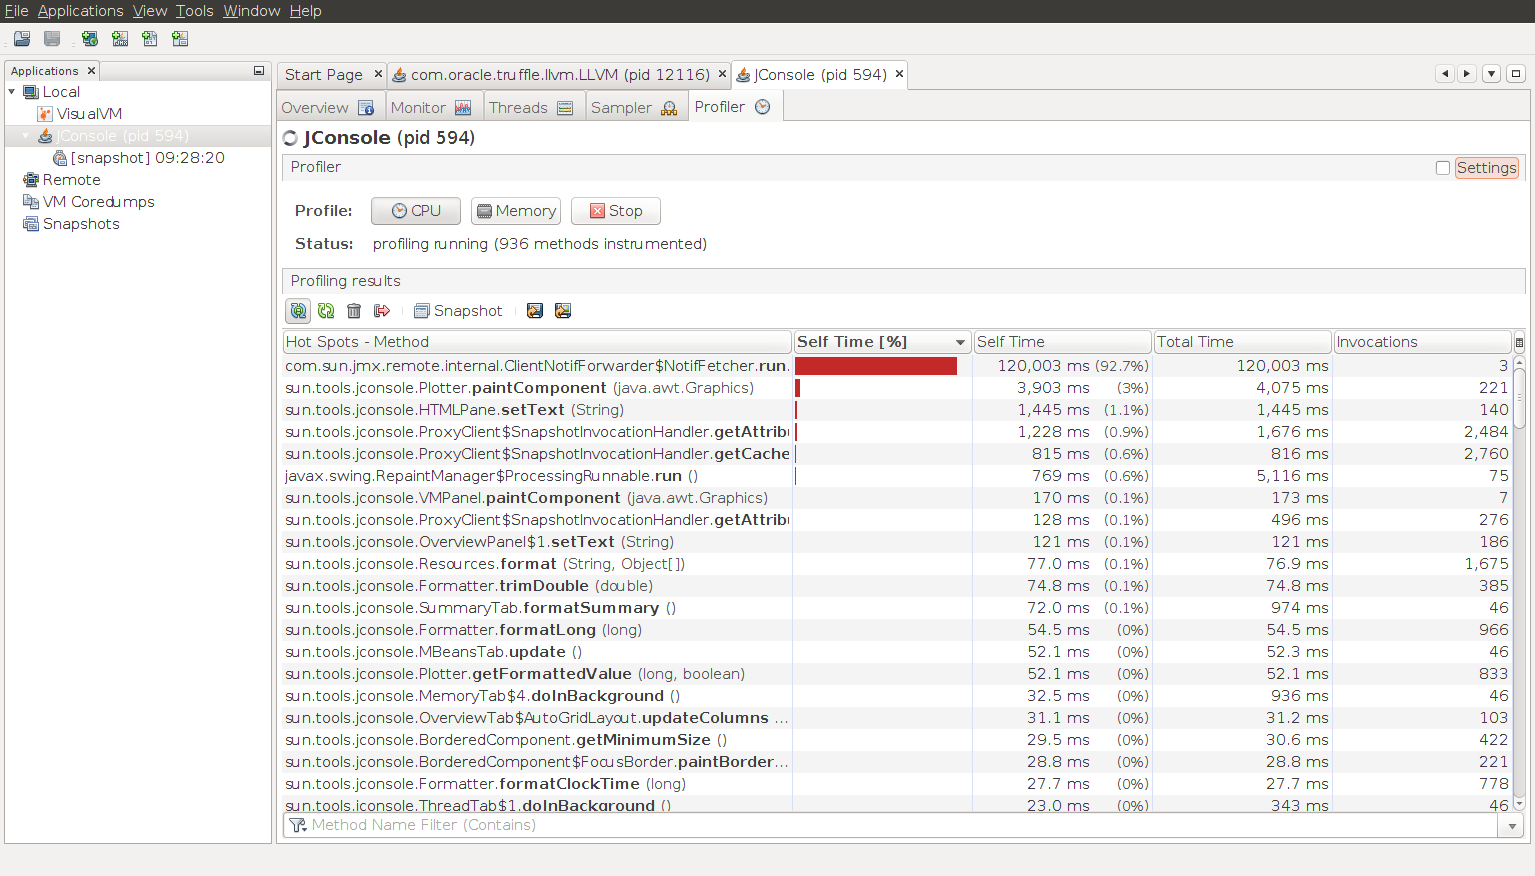
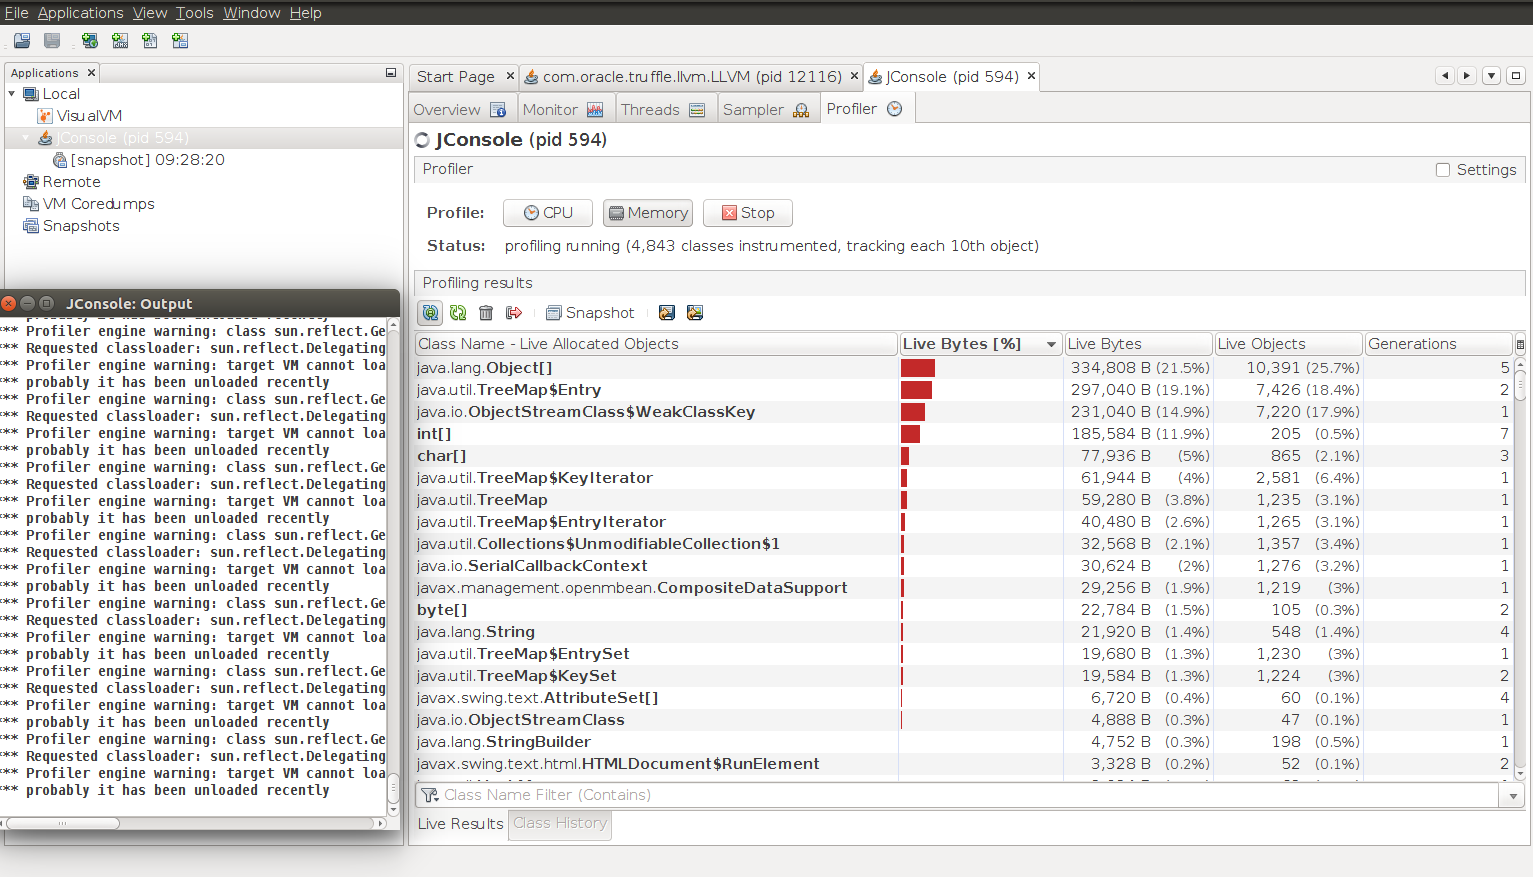
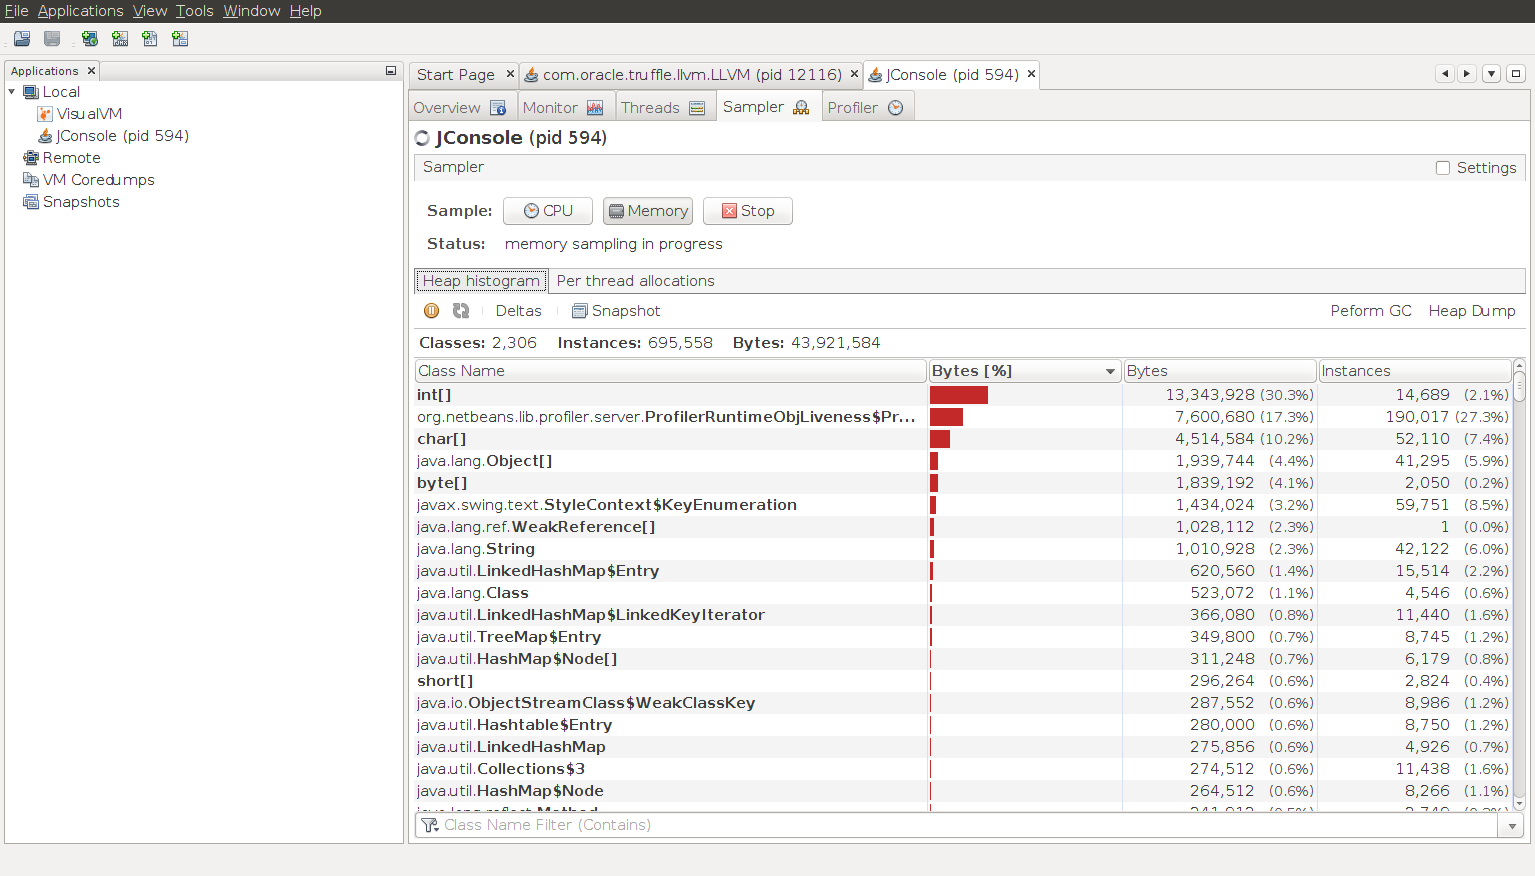
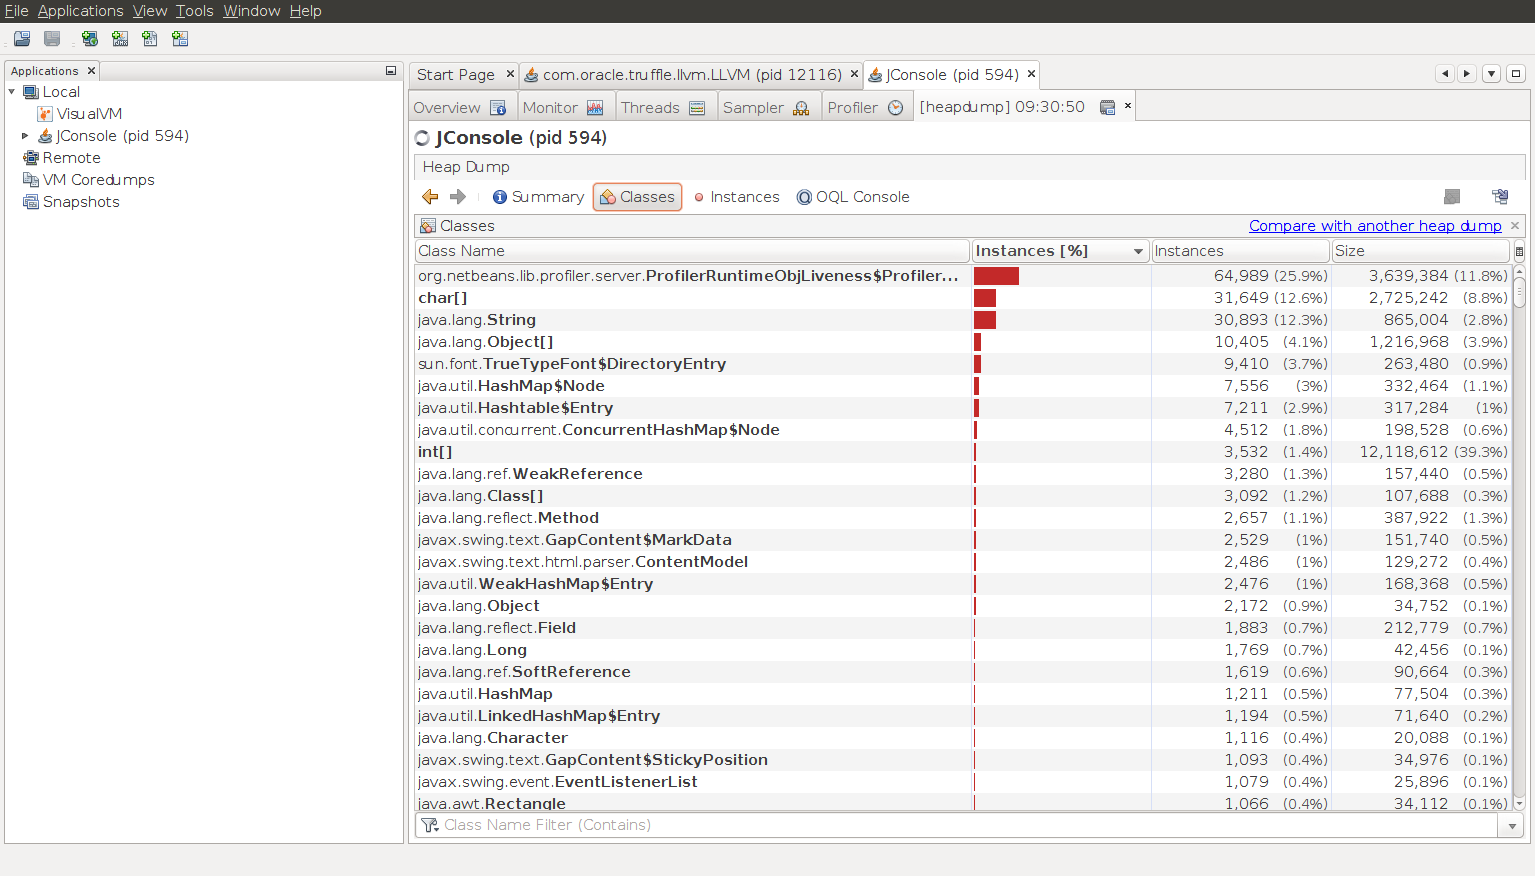
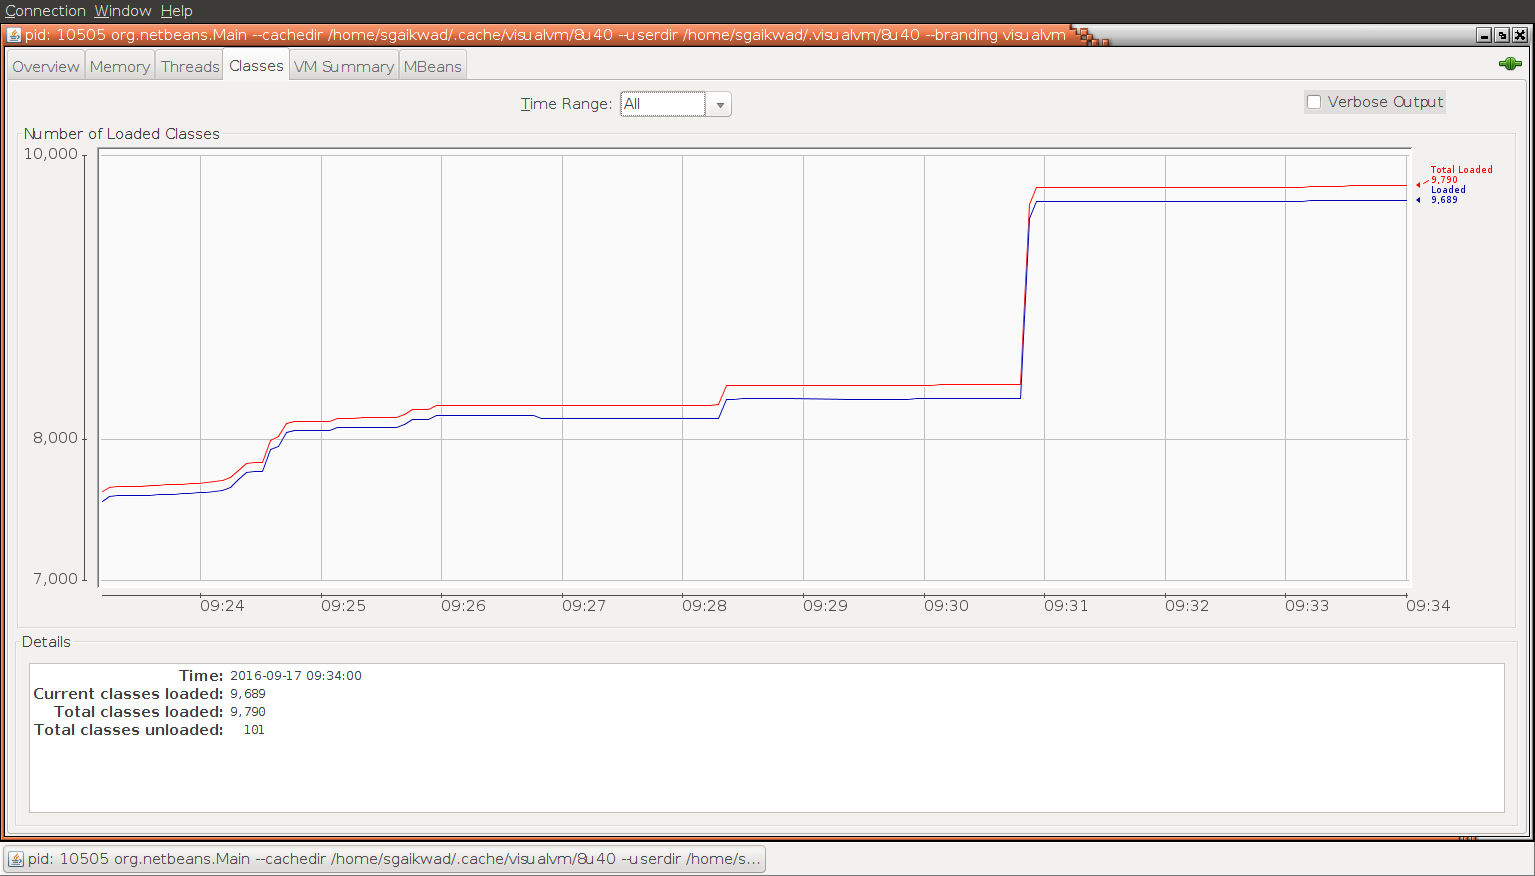
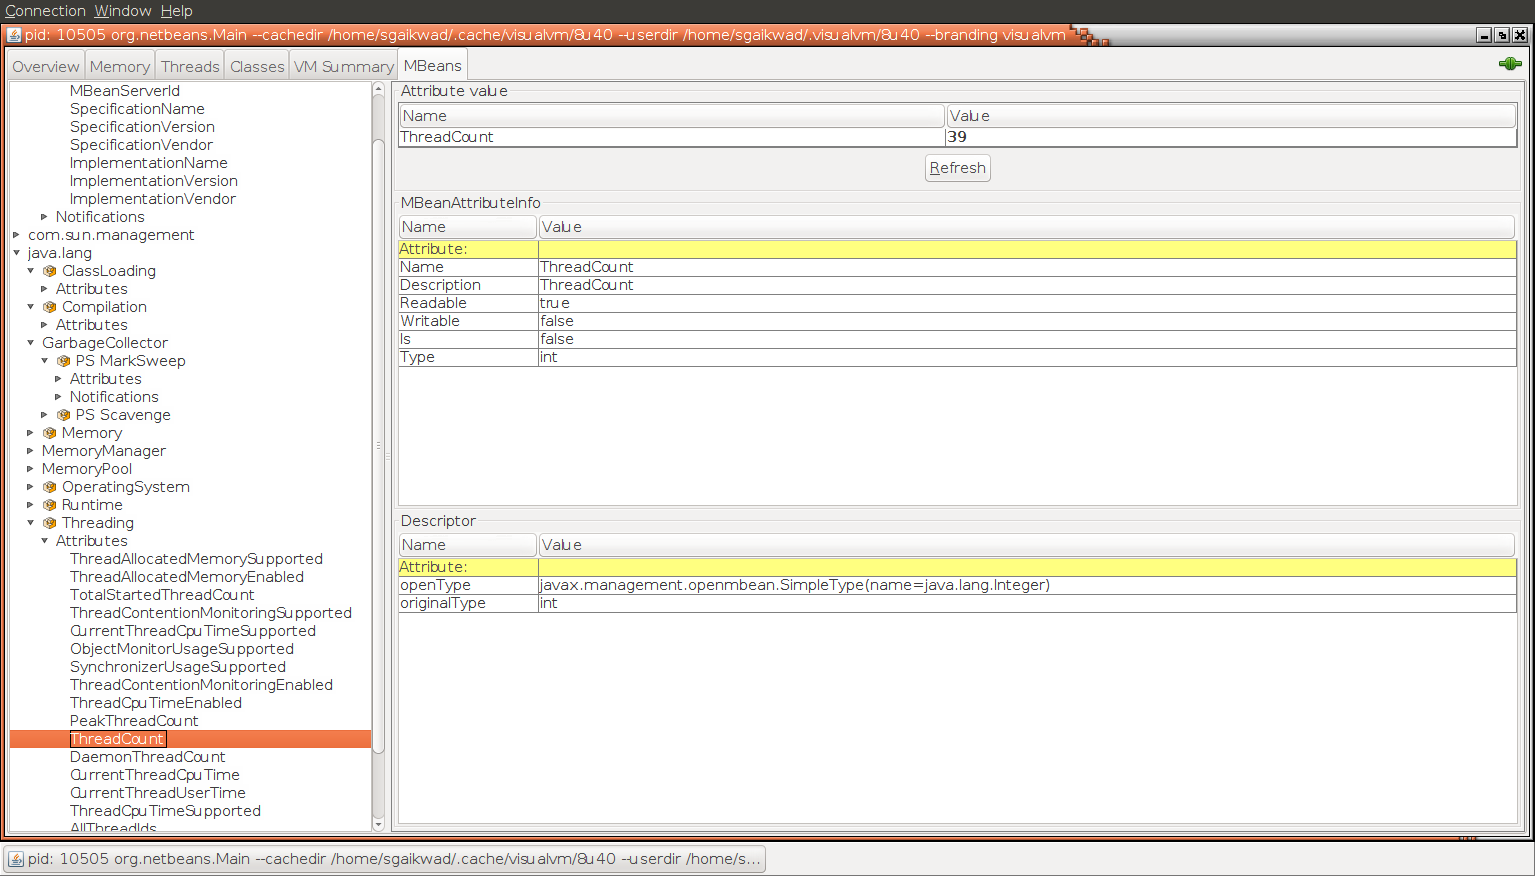
There was a small experiment done to montior jconsole instance with Java Visual VM.
 |
 |
 |
 |
 |
 |
 |
 |
 |
 |
 |
 |
 |
 |
Jmap
- To see the total number of instance of each class and total memory occupied them jmap is used.
jmap -histo <pid> - To see the list of live object only one can to use.
jmap -histo:live <pid> - By comparing the list of live and non-live class histogram one can see
- which classes/objects are living longer
- which classes may potentially leaking memory
- Jmap with -heap option gives all the details about the heap configuration and garbage collector details.
sudo jmap -heap <pid>
Resources
[1] Java Troubleshooting and Diagnostic Guide
http://www.oracle.com/technetwork/java/jdk50-ts-guide-149808.pdf
[2] Memory Management in the Java HotSpot™ Virtual Machine
http://www.oracle.com/technetwork/java/javase/memorymanagement-whitepaper-150215.pdf